Map of Regions
A map showing the locations of spring season net samples by CalCOFI for use in analyses of abundance and trends in pelagic resources. Channel Islands National Marine Sanctuary region (red) includes CalCOFI stations inside and adjacent to CINMS; and Southern California Shelf (yellow) includes all CalCOFI stations over the shelf. Figure credit: A. Thompson/NOAA, Ben Best/EcoQuants.
Larval fish, cool-water species
CINMS Region
A figure showing the relative abundance (how common or rare a species is) of cool-water associated (top) and warm-water associated (bottom) fish larvae around the Channel Islands and the Southern California Shelf from 1974 to 2015. The bar at the bottom of the figure can be used to zoom in to specific dates, using the small slider buttons on either edge of the bar. The blue horizontal line indicates the mean value for the time series. The horizontal gray bar shows one standard deviation above and below the mean. Data source: CalCOFI; Figure credit: A. Thompson/NOAA.
Click for Details
Relative abundance of cool-water and warm-water associated ichthyoplankton (fish larvae) groups collected in net samples during spring CalCOFI cruises at sites in the Channel Islands National Marine Sanctuary (CINMS) and over the Southern California Shelf from 1978 to 2015. Sampling sites are shown on Figure App.F.12.17. Symbol at upper right indicates whether data over the last five years (green shaded areas) had a positive trend (upward arrow), a negative trend (downward arrow), or no trend (↔). Symbol at lower right indicates whether the mean over the past five years was greater than (+), less than (-), or within 1 standard deviation (●) of the mean of the full time series. For more information, consult Figure App.F.15.5 in the CINMS 2016 Condition Report.SoCal Shelf Region
A figure showing the relative abundance (how common or rare a species is) of cool-water associated (top) and warm-water associated (bottom) fish larvae around the Channel Islands and the Southern California Shelf from 1974 to 2015. The bar at the bottom of the figure can be used to zoom in to specific dates, using the small slider buttons on either edge of the bar. The blue horizontal line indicates the mean value for the time series. The horizontal gray bar shows one standard deviation above and below the mean. Data source: CalCOFI; Figure credit: A. Thompson/NOAA.
Click for Details
Relative abundance of cool-water and warm-water associated ichthyoplankton (fish larvae) groups collected in net samples during spring CalCOFI cruises at sites in the Channel Islands National Marine Sanctuary (CINMS) and over the Southern California Shelf from 1978 to 2015. Sampling sites are shown on Figure App.F.12.17. Symbol at upper right indicates whether data over the last five years (green shaded areas) had a positive trend (upward arrow), a negative trend (downward arrow), or no trend (↔). Symbol at lower right indicates whether the mean over the past five years was greater than (+), less than (-), or within 1 standard deviation (●) of the mean of the full time series. For more information, consult Figure App.F.15.5 in the CINMS 2016 Condition Report.Larval fish, warm-water species
CINMS Region
A figure showing the relative abundance (how common or rare a species is) of cool-water associated (top) and warm-water associated (bottom) fish larvae around the Channel Islands and the Southern California Shelf from 1974 to 2015. The bar at the bottom of the figure can be used to zoom in to specific dates, using the small slider buttons on either edge of the bar. The blue horizontal line indicates the mean value for the time series. The horizontal gray bar shows one standard deviation above and below the mean. Data source: CalCOFI; Figure credit: A. Thompson/NOAA.
Click for Details
Relative abundance of cool-water and warm-water associated ichthyoplankton (fish larvae) groups collected in net samples during spring CalCOFI cruises at sites in the Channel Islands National Marine Sanctuary (CINMS) and over the Southern California Shelf from 1978 to 2015. Sampling sites are shown on Figure App.F.12.17. Symbol at upper right indicates whether data over the last five years (green shaded areas) had a positive trend (upward arrow), a negative trend (downward arrow), or no trend (↔). Symbol at lower right indicates whether the mean over the past five years was greater than (+), less than (-), or within 1 standard deviation (●) of the mean of the full time series. For more information, consult Figure App.F.15.5 in the CINMS 2016 Condition Report.SoCal Shelf Region
A figure showing the relative abundance (how common or rare a species is) of cool-water associated (top) and warm-water associated (bottom) fish larvae around the Channel Islands and the Southern California Shelf from 1974 to 2015. The bar at the bottom of the figure can be used to zoom in to specific dates, using the small slider buttons on either edge of the bar. The blue horizontal line indicates the mean value for the time series. The horizontal gray bar shows one standard deviation above and below the mean. Data source: CalCOFI; Figure credit: A. Thompson/NOAA.
Click for Details
Relative abundance of cool-water and warm-water associated ichthyoplankton (fish larvae) groups collected in net samples during spring CalCOFI cruises at sites in the Channel Islands National Marine Sanctuary (CINMS) and over the Southern California Shelf from 1978 to 2015. Sampling sites are shown on Figure App.F.12.17. Symbol at upper right indicates whether data over the last five years (green shaded areas) had a positive trend (upward arrow), a negative trend (downward arrow), or no trend (↔). Symbol at lower right indicates whether the mean over the past five years was greater than (+), less than (-), or within 1 standard deviation (●) of the mean of the full time series. For more information, consult Figure App.F.15.5 in the CINMS 2016 Condition Report.Larval fish - Mean Species Richness
CINMS Region
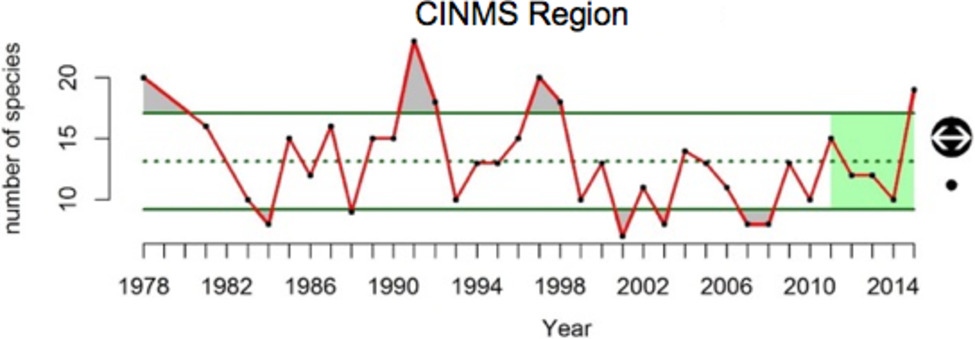
A figure showing the average number of different species of fish larvae collected around the Channel Islands (top) and the Southern California Shelf (bottom) from 1978 to 2015. Data source: CalCOFI; Figure credit: A. Thompson/NOAA.
Click for Details
Mean species richness of fish larvae (ichthyoplankton) collected in net samples during spring CalCOFI cruises at sites in the Channel Islands National Marine Sanctuary (CINMS) region and over the Southern California Shelf from 1978 to 2015. Species richness is the number of species present in a net sample. Species richness tends to increase in El Niño years due to influx of central Pacific species to the shelf. Sampling sites are shown on Figure App.F.12.17. Symbol at upper right indicates whether data over the last five years (green shaded areas) had a positive trend (upward arrow), a negative trend (downward arrow), or no trend (↔). Symbol at lower right indicates whether the mean over the past five years was greater than (+), less than (-), or within 1 standard deviation (●) of the mean of the full time series. For more information, consult Figure App.F.15.6.a-b in the CINMS 2016 Condition Report.SoCal Shelf Region
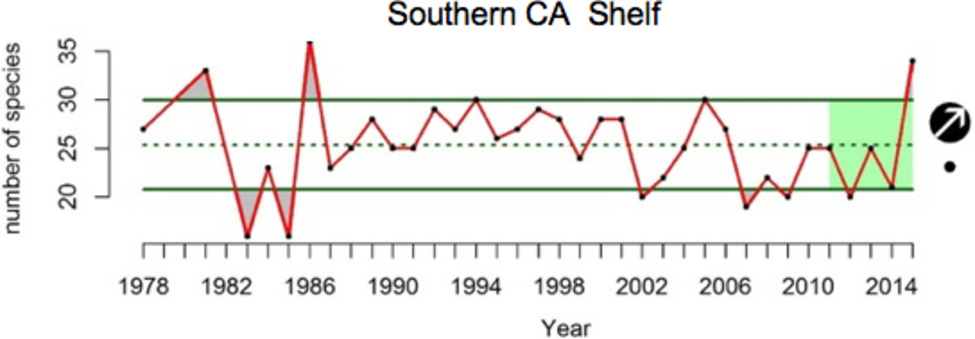
A figure showing the average number of different species of fish larvae collected around the Channel Islands (top) and the Southern California Shelf (bottom) from 1978 to 2015. Data source: CalCOFI; Figure credit: A. Thompson/NOAA.
Click for Details
Mean species richness of fish larvae (ichthyoplankton) collected in net samples during spring CalCOFI cruises at sites in the Channel Islands National Marine Sanctuary (CINMS) region and over the Southern California Shelf from 1978 to 2015. Species richness is the number of species present in a net sample. Species richness tends to increase in El Niño years due to influx of central Pacific species to the shelf. Sampling sites are shown on Figure App.F.12.17. Symbol at upper right indicates whether data over the last five years (green shaded areas) had a positive trend (upward arrow), a negative trend (downward arrow), or no trend (↔). Symbol at lower right indicates whether the mean over the past five years was greater than (+), less than (-), or within 1 standard deviation (●) of the mean of the full time series. For more information, consult Figure App.F.15.6.a-b in the CINMS 2016 Condition Report.Larval fish - Mean Simpson Diversity
CINMS Region
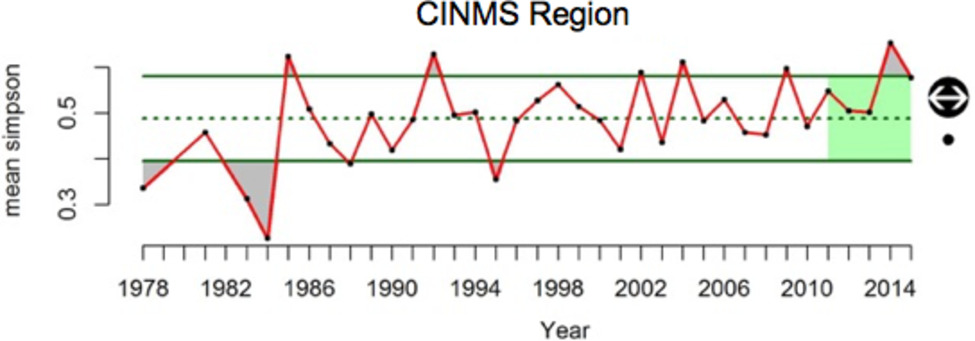
A figure showing the average diversity of larval fish collected around the Channel Islands (top) and the Southern California Shelf (bottom) from 1978 to 2015. Data source: CalCOFI; Figure credit: A. Thompson/NOAA.
Click for Details
Mean Simpon Diversity of larval fish in the CINMS region (top) and the Southern California Shelf (bottom) of associated ichthyoplankton (fish larvae) groups collected in net samples during spring CalCOFI cruises at sites in the Channel Islands National Marine Sanctuary (CINMS) region and over the Southern California Shelf from 1978 to 2015. Sampling sites are shown on Figure App.F.12.17. Symbol at upper right indicates whether data over the last five years (green shaded areas) had a positive trend (upward arrorow), a negative trend (downward arrow), or no trend (↔). Symbol at lower right indicates whether the mean over the past five years was greater than (+), less than (-), or within 1 standard deviation (●) of the mean of the full time series. For more information, consult Figure App.F.15.6.c-d in the CINMS 2016 Condition Report.SoCal Shelf Region
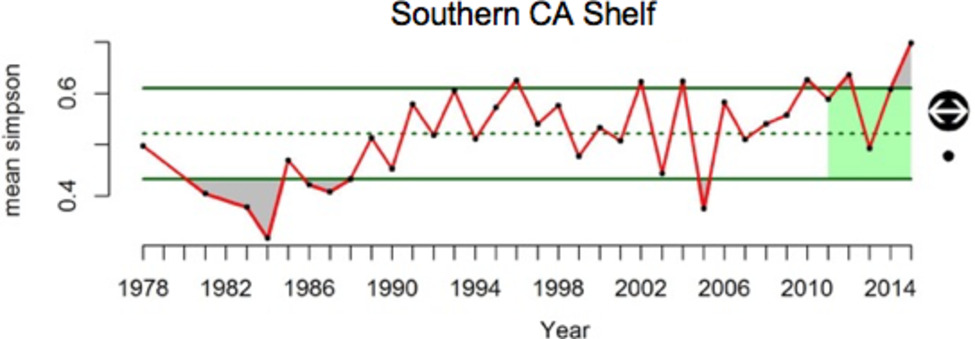
A figure showing the average diversity of larval fish collected around the Channel Islands (top) and the Southern California Shelf (bottom) from 1978 to 2015. Data source: CalCOFI; Figure credit: A. Thompson/NOAA.